Note
Go to the end to download the full example code.
Advanced: Parameter Optimization with Grid Search#
This example demonstrates how to optimize kernel parameters and explore the performance of the KKF with different configurations.
======================================================================
KKF Advanced Example: Parameter Exploration
======================================================================
Nonlinear System created:
Dynamics: x[k+1] = [0.5*x[0] + sin(x[1]), 0.7*x[1] - 0.1*x[0]²]
Observation: y[k] = x[0] + 0.1*x[1]²
Generating synthetic data...
✓ Generated 80 timesteps
Exploring different kernel configurations...
Testing with 10 features:
Testing RBF (0.5)... ✓ Error: 0.246964
Testing RBF (1.0)... ✓ Error: 0.197893
Testing RBF (2.0)... ✓ Error: 0.157648
Testing Matern (0.5, ν=0.5)... ✓ Error: 0.188136
Testing Matern (1.0, ν=0.5)... ✓ Error: 0.153730
Testing Matern (1.0, ν=1.5)... ✓ Error: 0.167921
Testing Matern (1.0, ν=2.5)... ✓ Error: 0.464270
Testing ExpSineSquared... /home/docs/checkouts/readthedocs.org/user_builds/kkf/envs/latest/lib/python3.11/site-packages/sklearn/gaussian_process/kernels.py:2072: RuntimeWarning: invalid value encountered in sin
-2 * (np.sin(np.pi / self.periodicity * dists) / self.length_scale) ** 2
/home/docs/checkouts/readthedocs.org/user_builds/kkf/checkouts/latest/examples/03_advanced_parameter_exploration.py:51: RuntimeWarning: overflow encountered in scalar power
return np.array([x[0] + 0.1 * x[1] ** 2])
/home/docs/checkouts/readthedocs.org/user_builds/kkf/envs/latest/lib/python3.11/site-packages/numpy/lib/_function_base_impl.py:2882: RuntimeWarning: invalid value encountered in subtract
X -= avg[:, None]
Error: SVD did not converge
✗ Failed
Testing with 20 features:
Testing RBF (0.5)... ✓ Error: 0.162378
Testing RBF (1.0)... ✓ Error: 0.153422
Testing RBF (2.0)... ✓ Error: 1.057204
Testing Matern (0.5, ν=0.5)... ✓ Error: 0.155281
Testing Matern (1.0, ν=0.5)... ✓ Error: 0.150585
Testing Matern (1.0, ν=1.5)... ✓ Error: 0.155577
Testing Matern (1.0, ν=2.5)... ✓ Error: 0.154337
Testing ExpSineSquared... /home/docs/checkouts/readthedocs.org/user_builds/kkf/checkouts/latest/examples/03_advanced_parameter_exploration.py:46: RuntimeWarning: overflow encountered in scalar power
0.7 * x[1] - 0.1 * x[0] ** 2
Error: SVD did not converge
✗ Failed
Testing with 30 features:
Testing RBF (0.5)... ✓ Error: 0.153650
Testing RBF (1.0)... ✓ Error: 0.152816
Testing RBF (2.0)... ✓ Error: 0.352561
Testing Matern (0.5, ν=0.5)... ✓ Error: 0.153690
Testing Matern (1.0, ν=0.5)... ✓ Error: 0.150283
Testing Matern (1.0, ν=1.5)... ✓ Error: 0.148903
Testing Matern (1.0, ν=2.5)... ✓ Error: 0.151051
Testing ExpSineSquared... /home/docs/checkouts/readthedocs.org/user_builds/kkf/envs/latest/lib/python3.11/site-packages/numpy/lib/_function_base_impl.py:2887: RuntimeWarning: overflow encountered in dot
c = dot(X, X_T.conj())
Error: SVD did not converge
✗ Failed
======================================================================
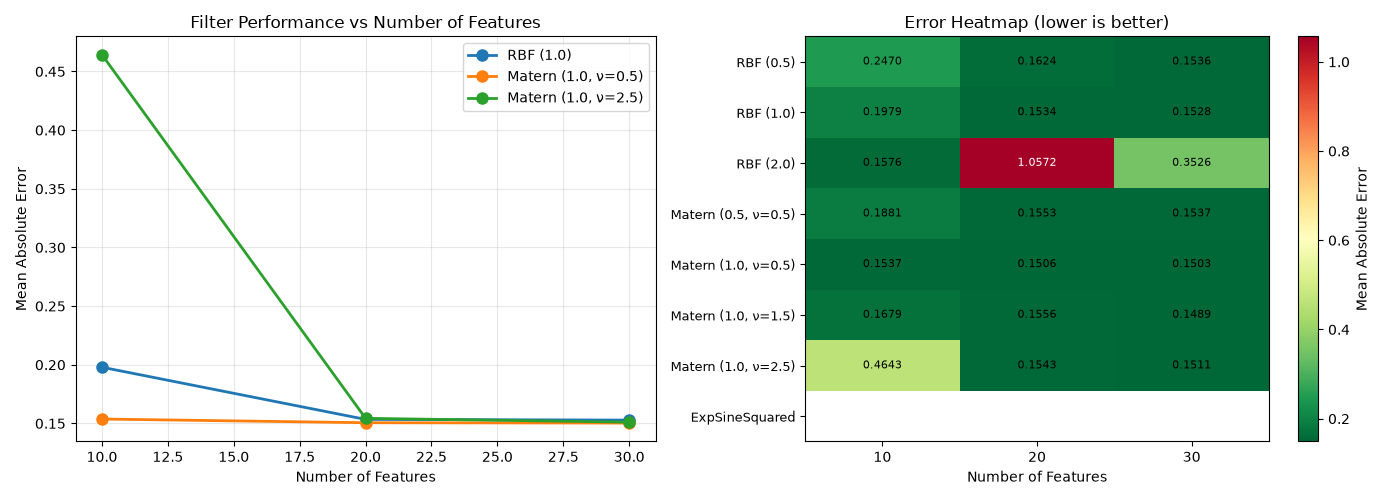
Summary of Results (Mean Absolute Error):
======================================================================
Kernel Config 10 Features 20 Features 30 Features
---------------------------------------------------------------------------
RBF (0.5) 0.246964 0.162378 0.153650
RBF (1.0) 0.197893 0.153422 0.152816
RBF (2.0) 0.157648 1.057204 0.352561
Matern (0.5, ν=0.5) 0.188136 0.155281 0.153690
Matern (1.0, ν=0.5) 0.153730 0.150585 0.150283
Matern (1.0, ν=1.5) 0.167921 0.155577 0.148903
Matern (1.0, ν=2.5) 0.464270 0.154337 0.151051
ExpSineSquared nan nan nan
======================================================================
Best Configuration: Matern (1.0, ν=1.5) with 30 features
Mean Absolute Error: 0.148903
======================================================================
Generating comparison plots...
Figure saved as 'kkf_parameter_exploration.png'
======================================================================
Advanced example completed successfully!
======================================================================
import numpy as np
import matplotlib.pyplot as plt
from scipy import stats
from sklearn.gaussian_process.kernels import Matern, RBF, ExpSineSquared

from kkf import DynamicalSystem, KoopmanOperator, apply_koopman_kalman_filter


def evaluate_filter(system, kernel, n_features, observations, initial_dist, noise_samples=50):
    """Evaluate filter performance for a given kernel."""
    try:
        koop = KoopmanOperator(kernel, system)
        solution = apply_koopman_kalman_filter(
            koopman_operator=koop,
            observations=observations,
            initial_distribution=initial_dist,
            n_features=n_features,
            optimize=False,
            noise_samples=noise_samples,
        )
        return solution
    except Exception as e:
        print(f"  Error: {e}")
        return None


def main():
    """Run advanced optimization example."""
    print("=" * 70)
    print("KKF Advanced Example: Parameter Exploration")
    print("=" * 70)

    # Create nonlinear system
    def f(x):
        """Nonlinear dynamics."""
        return np.array([
            0.5 * x[0] + np.sin(x[1]),
            0.7 * x[1] - 0.1 * x[0] ** 2
        ])

    def g(x):
        """Nonlinear observation."""
        return np.array([x[0] + 0.1 * x[1] ** 2])

    nx, ny = 2, 1
    X_dist = stats.multivariate_normal(mean=np.zeros(nx), cov=np.eye(nx))
    dyn_noise = stats.multivariate_normal(mean=np.zeros(nx), cov=0.01 * np.eye(nx))
    obs_noise = stats.multivariate_normal(mean=np.zeros(ny), cov=0.02 * np.eye(ny))

    system = DynamicalSystem(
        nx=nx,
        ny=ny,
        f=f,
        g=g,
        dist_X=X_dist,
        dist_dyn=dyn_noise,
        dist_obs=obs_noise,
        discrete_time=True,
    )

    print(f"\nNonlinear System created:")
    print(f"  Dynamics: x[k+1] = [0.5*x[0] + sin(x[1]), 0.7*x[1] - 0.1*x[0]²]")
    print(f"  Observation: y[k] = x[0] + 0.1*x[1]²")

    # Generate data
    print(f"\nGenerating synthetic data...")
    n_timesteps = 80
    x_true = np.zeros((n_timesteps, nx))
    y_meas = np.zeros((n_timesteps, ny))

    x_true[0] = np.array([1.0, 0.5])
    y_meas[0] = g(x_true[0]) + obs_noise.rvs()

    np.random.seed(42)
    for t in range(1, n_timesteps):
        x_true[t] = f(x_true[t - 1]) + dyn_noise.rvs()
        y_meas[t] = g(x_true[t]) + obs_noise.rvs()

    print(f"  ✓ Generated {n_timesteps} timesteps")

    # Kernel parameter exploration
    print(f"\nExploring different kernel configurations...")

    kernels_to_test = {
        "RBF (0.5)": RBF(length_scale=0.5),
        "RBF (1.0)": RBF(length_scale=1.0),
        "RBF (2.0)": RBF(length_scale=2.0),
        "Matern (0.5, ν=0.5)": Matern(length_scale=0.5, nu=0.5),
        "Matern (1.0, ν=0.5)": Matern(length_scale=1.0, nu=0.5),
        "Matern (1.0, ν=1.5)": Matern(length_scale=1.0, nu=1.5),
        "Matern (1.0, ν=2.5)": Matern(length_scale=1.0, nu=2.5),
        "ExpSineSquared": ExpSineSquared(length_scale=1.0, periodicity=1.0),
    }

    n_features_list = [10, 20, 30]
    results = {}

    for n_feat in n_features_list:
        results[n_feat] = {}
        print(f"\n  Testing with {n_feat} features:")

        for kernel_name, kernel in kernels_to_test.items():
            print(f"    Testing {kernel_name}...", end=" ")

            solution = evaluate_filter(
                system,
                kernel,
                n_feat,
                y_meas,
                stats.multivariate_normal(mean=x_true[0], cov=0.1 * np.eye(nx)),
                noise_samples=50,
            )

            if solution is not None:
                error = np.mean(np.linalg.norm(solution.x_plus - x_true, axis=1))
                results[n_feat][kernel_name] = error
                print(f"✓ Error: {error:.6f}")
            else:
                results[n_feat][kernel_name] = np.nan
                print(f"✗ Failed")

    # Print summary
    print(f"\n" + "=" * 70)
    print("Summary of Results (Mean Absolute Error):")
    print("=" * 70)
    print(f"{'Kernel Config':<30} {'10 Features':<15} {'20 Features':<15} {'30 Features':<15}")
    print("-" * 75)

    for kernel_name in kernels_to_test.keys():
        e10 = results[10].get(kernel_name, np.nan)
        e20 = results[20].get(kernel_name, np.nan)
        e30 = results[30].get(kernel_name, np.nan)

        print(
            f"{kernel_name:<30} {e10:<15.6f} {e20:<15.6f} {e30:<15.6f}"
        )

    # Find best configuration
    best_config = None
    best_error = np.inf

    for n_feat, kernel_results in results.items():
        for kernel_name, error in kernel_results.items():
            if not np.isnan(error) and error < best_error:
                best_error = error
                best_config = (n_feat, kernel_name)

    print("\n" + "=" * 70)
    if best_config:
        print(f"Best Configuration: {best_config[1]} with {best_config[0]} features")
        print(f"Mean Absolute Error: {best_error:.6f}")
    print("=" * 70)

    # Visualization of results
    print(f"\nGenerating comparison plots...")

    fig, axes = plt.subplots(1, 2, figsize=(14, 5))

    # Plot 1: Error vs number of features for different kernels
    for kernel_name in ["RBF (1.0)", "Matern (1.0, ν=0.5)", "Matern (1.0, ν=2.5)"]:
        errors = []
        features = sorted(results.keys())
        for n_feat in features:
            err = results[n_feat].get(kernel_name, np.nan)
            errors.append(err if not np.isnan(err) else None)

        # Filter out None values
        valid_idx = [i for i, e in enumerate(errors) if e is not None]
        if valid_idx:
            axes[0].plot(
                [features[i] for i in valid_idx],
                [errors[i] for i in valid_idx],
                "o-",
                label=kernel_name,
                linewidth=2,
                markersize=8,
            )

    axes[0].set_xlabel("Number of Features")
    axes[0].set_ylabel("Mean Absolute Error")
    axes[0].set_title("Filter Performance vs Number of Features")
    axes[0].legend()
    axes[0].grid(True, alpha=0.3)

    # Plot 2: Heatmap of errors
    kernel_names = list(kernels_to_test.keys())
    error_matrix = np.zeros((len(kernel_names), len(n_features_list)))

    for i, kernel_name in enumerate(kernel_names):
        for j, n_feat in enumerate(n_features_list):
            error_matrix[i, j] = results[n_feat].get(kernel_name, np.nan)

    im = axes[1].imshow(error_matrix, cmap="RdYlGn_r", aspect="auto")
    axes[1].set_xticks(np.arange(len(n_features_list)))
    axes[1].set_yticks(np.arange(len(kernel_names)))
    axes[1].set_xticklabels(n_features_list)
    axes[1].set_yticklabels(kernel_names, fontsize=9)
    axes[1].set_xlabel("Number of Features")
    axes[1].set_title("Error Heatmap (lower is better)")

    # Add text annotations
    for i in range(len(kernel_names)):
        for j in range(len(n_features_list)):
            text = axes[1].text(
                j,
                i,
                f"{error_matrix[i, j]:.4f}",
                ha="center",
                va="center",
                color="black" if error_matrix[i, j] < np.nanmax(error_matrix) / 2 else "white",
                fontsize=8,
            )

    cbar = plt.colorbar(im, ax=axes[1])
    cbar.set_label("Mean Absolute Error")

    plt.tight_layout()
    plt.savefig("kkf_parameter_exploration.png", dpi=100, bbox_inches="tight")
    print("  Figure saved as 'kkf_parameter_exploration.png'")

    plt.show()

    print("\n" + "=" * 70)
    print("Advanced example completed successfully!")
    print("=" * 70)


if __name__ == "__main__":
    main()
Total running time of the script: (0 minutes 2.078 seconds)